Example Gallery
The following are the examples of the statistical learning of nuclear shielding tensor parameters from pure anisotropic NMR spectrum.
One-dimensional synthetic datasets
This sub-section is for illustration only. For the practical application of the inversion method, refer to the next sub-section.
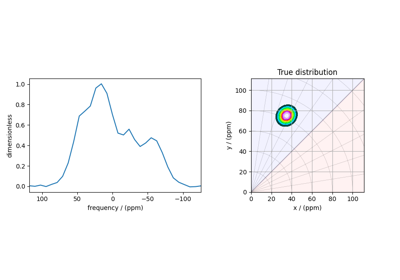
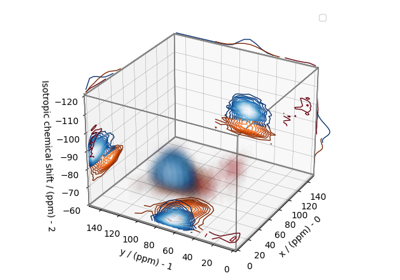
Unimodal distribution (Aniso Shielding Sideband Inversion)
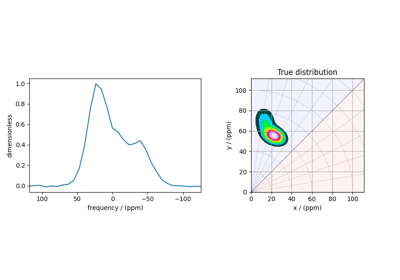
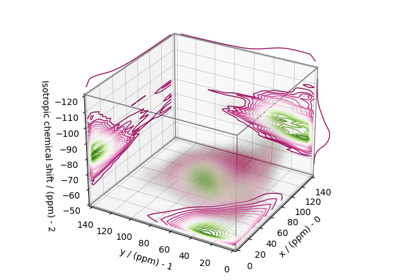
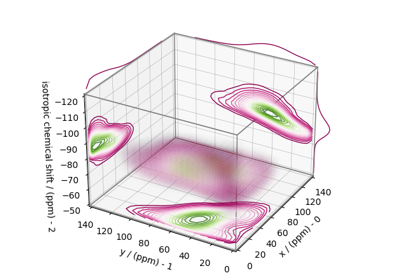
Bimodal distribution (Aniso Shielding Sideband Inversion)
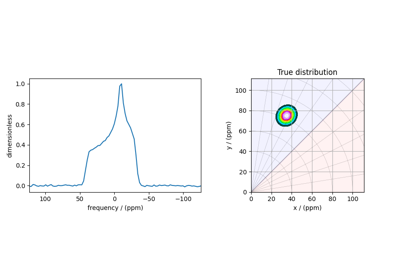
Unimodal distribution (Aniso Shielding Lineshape Inversion)
Bimodal distribution (Aniso Shielding Lineshape Inversion)
Spinning sideband spectrum (Experiment)
The following are the examples of the statistical learning of nuclear shielding tensor from pure anisotropic spinning sideband spectrum.
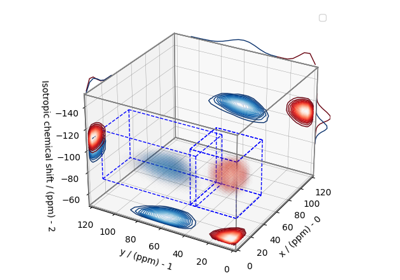
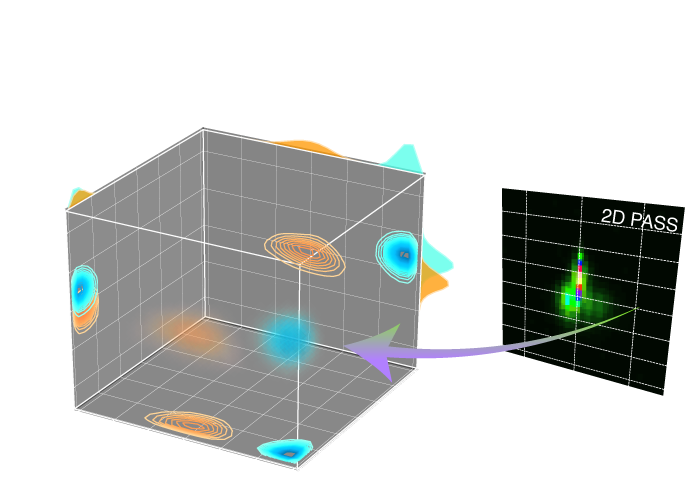
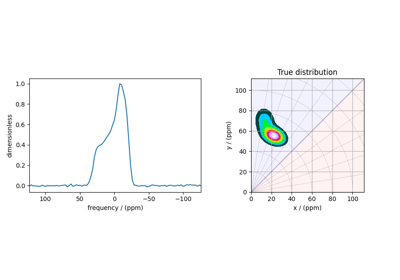
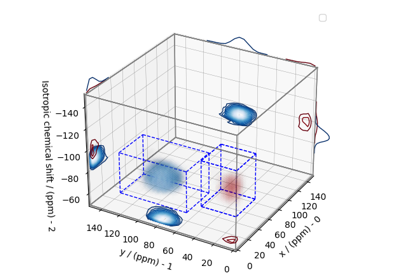
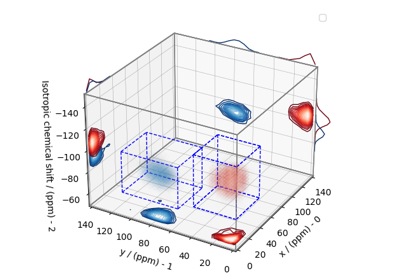
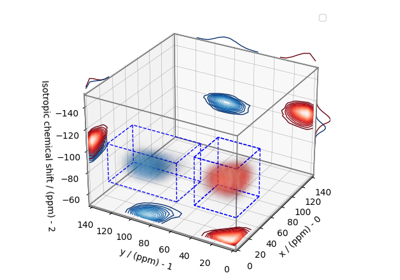
Magic angle flipping (Experiment)
The following are the examples of the statistical learning method applied in determining a distribution of the nuclear shielding tensor parameters from a 2D MAF NMR spectrum correlating the isotropic to the anisotropic frequency contributions.
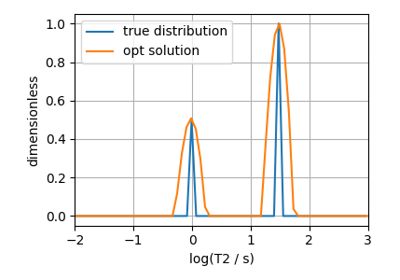
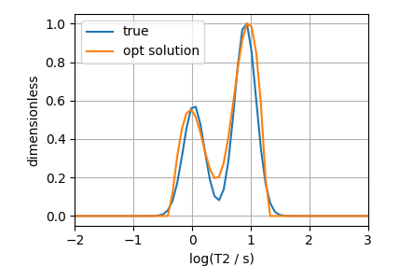
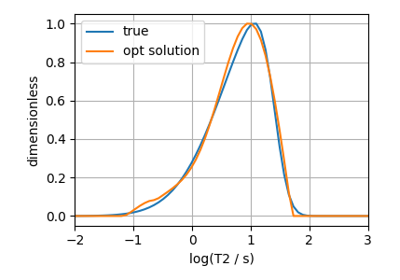
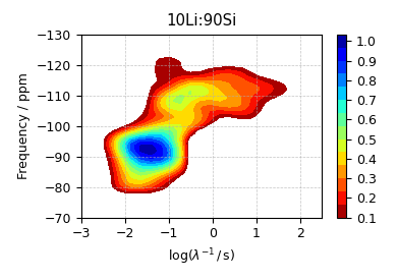
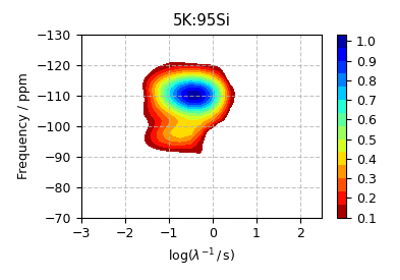
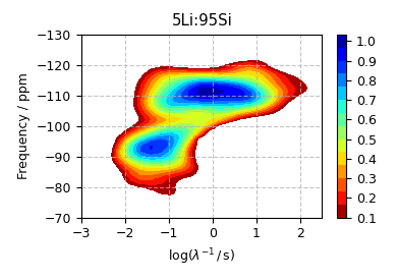
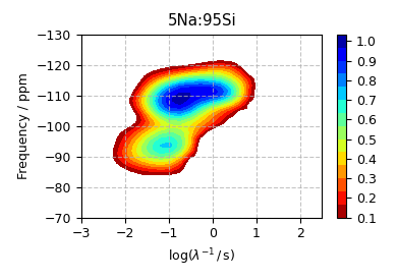
Relaxation in Glasses (Experiment)
The following are the examples of the statistical learning of relaxation parameter distribution in glasses.
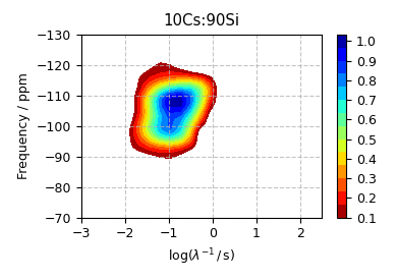
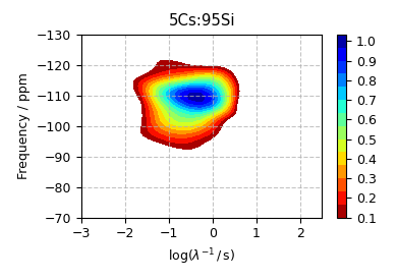
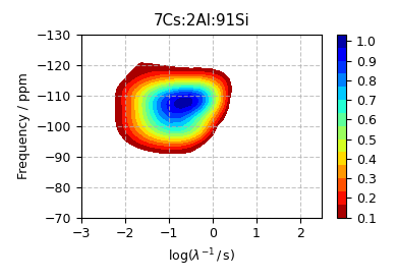
0.07 Cs2O • 0.02 Al2O3 • 0.001 SnO2 • 0.91 SiO2 MAS-ETA
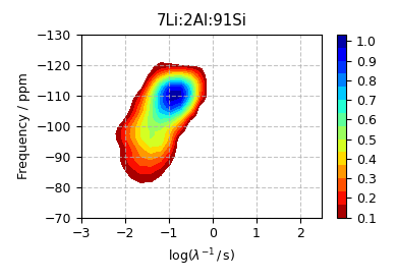
0.07 Li2O • 0.02 Al2O3 • 0.001 SnO2 • 0.91 SiO2 MAS-ETA